Configure Monitoring Behavior With Prometheus
This document provides the step-by-step instruction to set up monitoring for your application.
As of today, Kusion supports the configuration of Prometheus scraping behaviors for the target application. In the future, we will add more cloud-provider-native solutions, such as AWS CloudWatch, Azure Monitor, etc.
The user guide below is composed of the following components:
- Namespace
- Deployment
- Service
- ServiceMonitor
This guide requires you to have a basic understanding of Kubernetes and Prometheus. If you are not familiar with the relevant concepts, please refer to the links below:
Pre-requisite
Please refer to the prerequisites in the guide for deploying an application.
The example below also requires you to have initialized the project using the kusion init command, which will generate a kcl.mod file under the project directory.
Setting up your own Prometheus
There a quite a few ways to set up Prometheus in your cluster:
- Installing a Prometheus operator
- Installing a standalone Prometheus server
- Installing a Prometheus agent and connect to a remote Prometheus server
The advice from the Prometheus team is to use the ServiceMonitor or PodMonitor CRs via the Prometheus operator to manage scrape configs going forward[2].
In either case, you only have to do this setup once per cluster. This doc will use a minikube cluster and Prometheus operator as an example.
Installing Prometheus operator[3].
To get the example in this user guide working, all you need is a running Prometheus operator. You can have that installed by running:
LATEST=$(curl -s https://api.github.com/repos/prometheus-operator/prometheus-operator/releases/latest | jq -cr .tag_name)
curl -sL https://github.com/prometheus-operator/prometheus-operator/releases/download/${LATEST}/bundle.yaml | kubectl create -f -
This will install all the necessary CRDs and the Prometheus operator itself in the default namespace. Wait a few minutes, you can confirm the operator is up by running:
kubectl wait --for=condition=Ready pods -l app.kubernetes.io/name=prometheus-operator -n default
Make sure RBAC is properly set up
If you have RBAC enabled on the cluster, the following must be created for Prometheus to work properly:
apiVersion: v1
kind: ServiceAccount
metadata:
  name: prometheus
---
apiVersion: rbac.authorization.k8s.io/v1
kind: ClusterRole
metadata:
  name: prometheus
rules:
- apiGroups: [""]
  resources:
  - nodes
  - nodes/metrics
  - services
  - endpoints
  - pods
  verbs: ["get", "list", "watch"]
- apiGroups: [""]
  resources:
  - configmaps
  verbs: ["get"]
- apiGroups:
  - networking.k8s.io
  resources:
  - ingresses
  verbs: ["get", "list", "watch"]
- nonResourceURLs: ["/metrics"]
  verbs: ["get"]
---
apiVersion: rbac.authorization.k8s.io/v1
kind: ClusterRoleBinding
metadata:
  name: prometheus
roleRef:
  apiGroup: rbac.authorization.k8s.io
  kind: ClusterRole
  name: prometheus
subjects:
- kind: ServiceAccount
  name: prometheus
  namespace: default
Configure Prometheus instance via the operator
Once all of the above is set up, you can then configure the Prometheus instance via the operator:
apiVersion: monitoring.coreos.com/v1
kind: Prometheus
metadata:
  name: prometheus
spec:
  serviceAccountName: prometheus
  serviceMonitorNamespaceSelector: {}
  serviceMonitorSelector: {}
  podMonitorNamespaceSelector: {}
  podMonitorSelector: {}
  resources:
    requests:
      memory: 400Mi
This Prometheus instance above will be cluster-wide, picking up ALL the service monitors and pod monitors across ALL the namespaces. You can adjust the requests and limits accordingly if you have a larger cluster.
Exposing the Prometheus portal (optional)
Once you have the managed Prometheus instance created via the Prometheus CR above, you should be able to see a service created called prometheus-operated:

If you are also running on minikube, you can expose it onto your localhost via kubectl:
kubectl port-forward svc/prometheus-operated 9099:9090
You should then be able to see the Prometheus portal via localhost:9099 in your browser:
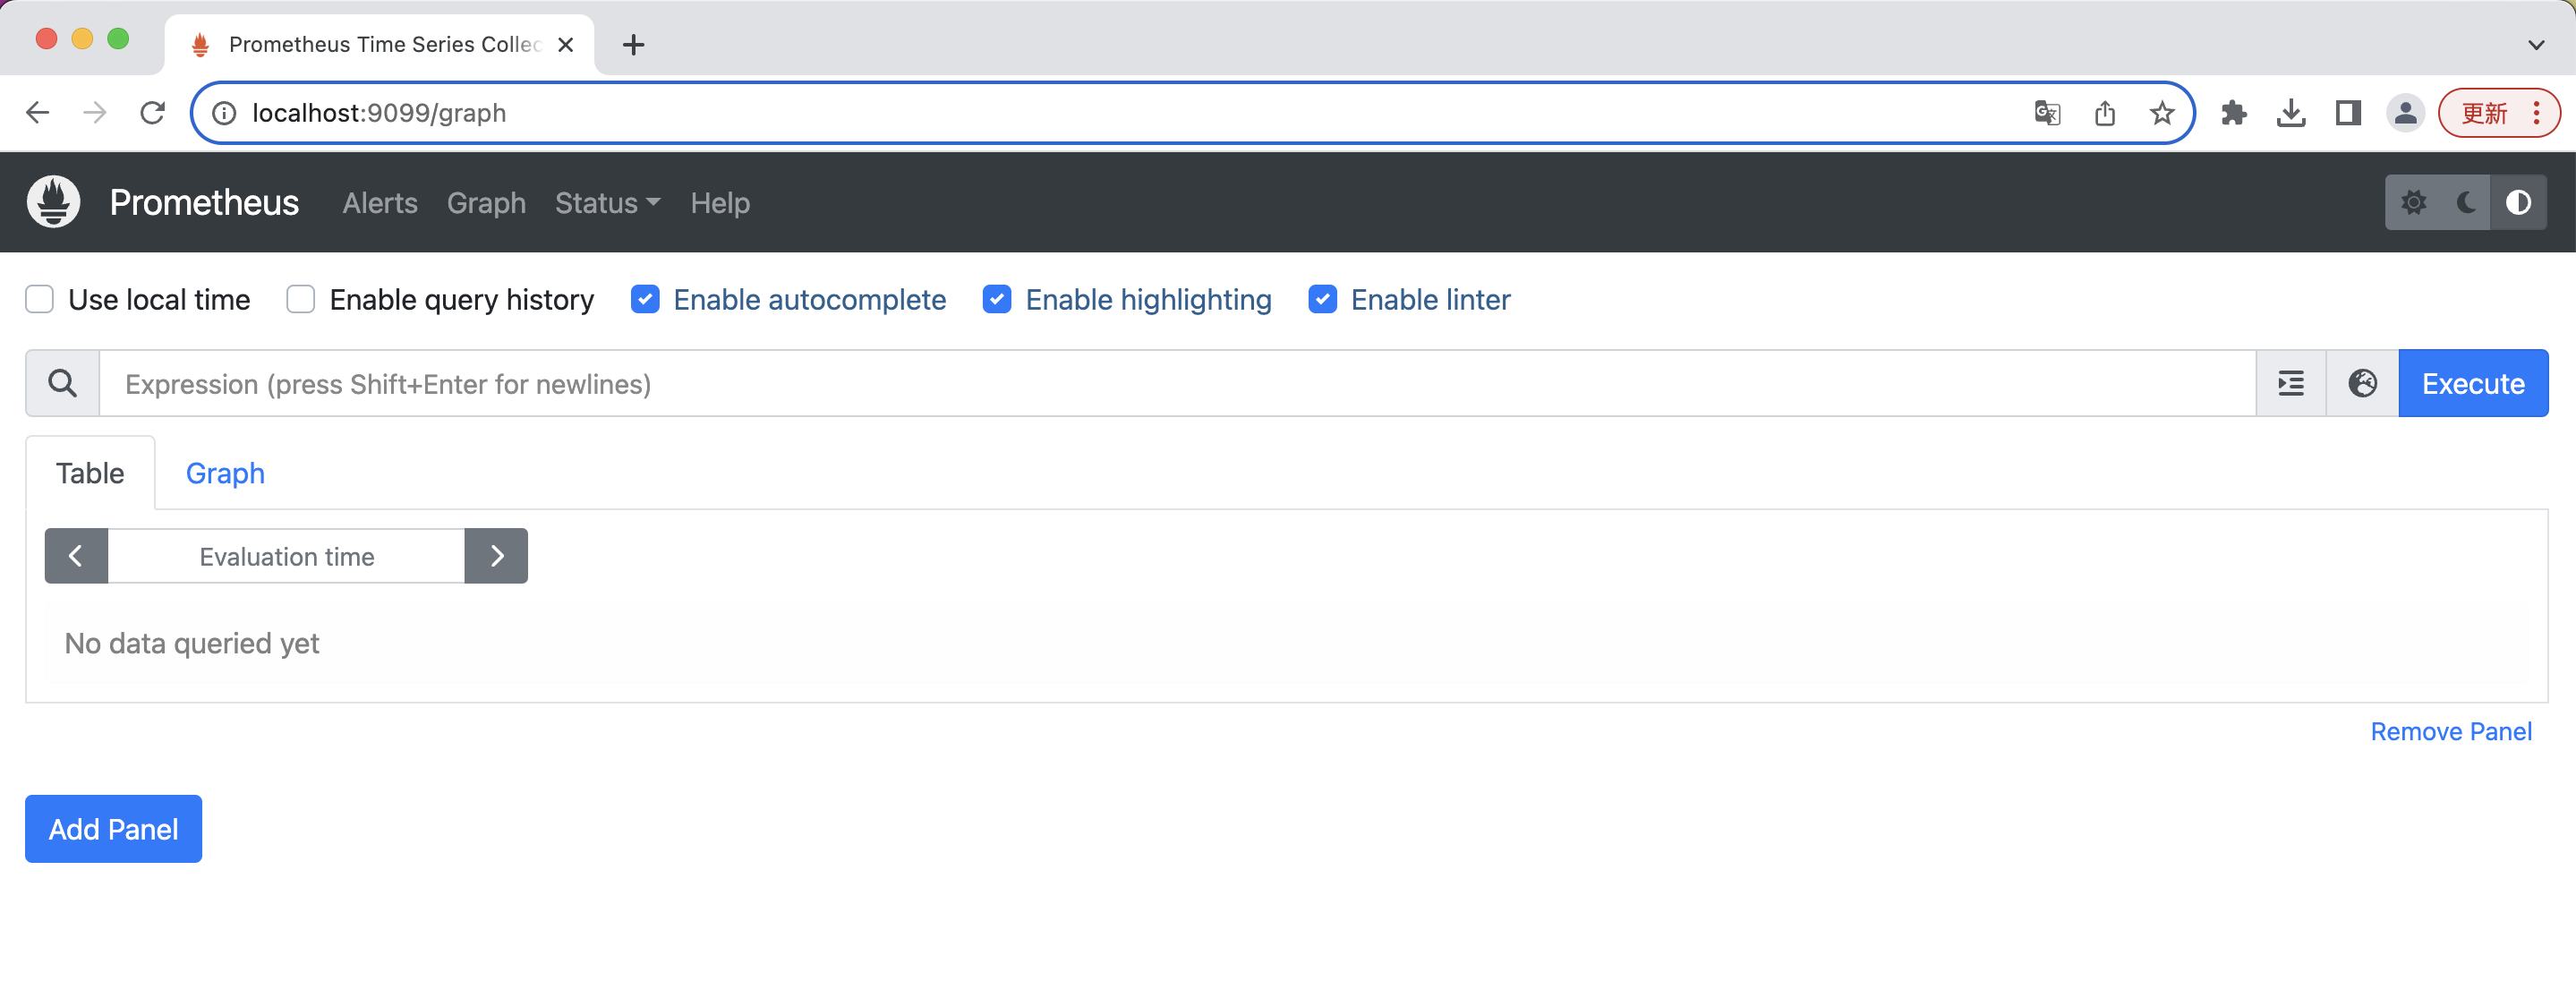
If you are running a non-local cluster, you can try to expose it via another way, through an ingress controller for example.
Setting up workspace configs
Since v0.10.0, we have introduced the concept of workspaces, whose configurations represent the part of the application behaviors that platform teams are interested in standardizing, or the ones to eliminate from developer's mind to make their lives easier.
In the case of setting up Prometheus, there are a few things to set up on the workspace level:
Operator mode
The operatorMode flag indicates to Kusion whether the Prometheus instance installed in the cluster runs as a Kubernetes operator or not. This determines the different kinds of resources Kusion manages.
To see more about different ways to run Prometheus in the Kubernetes cluster, please refer to the design documentation.
Most cloud vendors provide an out-of-the-box monitoring solutions for workloads running in a managed-Kubernetes cluster (EKS, AKS, etc), such as AWS CloudWatch, Azure Monitor, etc. These solutions mostly involve installing an agent (CloudWatch Agent, OMS Agent, etc) in the cluster and collecting the metrics to a centralized monitoring server. In those cases, you don't need to set operatorMode to True. It only needs to be set to True when you have an installation of the Prometheus operator running inside the Kubernetes cluster.
For differences between Prometheus operator, kube-prometheus and the community kube-prometheus-stack helm chart, the details are documented here.
Monitor types
The monitorType flag indicates the kind of monitor Kusion will create. It only applies when operatorMode is set to True. As of version 0.10.0, Kusion provides options to scrape metrics from either the application pods or its corresponding Kubernetes services. This determines the different kinds of resources Kusion manages when Prometheus runs as an operator in the target cluster.
A sample workspace.yaml with Prometheus settings:
modules:
  ...
  kusionstack/monitoring@0.1.0:
    default:
      operatorMode: True
      monitorType: Service
      scheme: http
      interval: 30s
      timeout: 15s
...
To instruct Prometheus to scrape from pod targets instead:
modules:
  ...
  kusionstack/monitoring@0.1.0:
    default:
      operatorMode: True
      monitorType: Pod
      scheme: http
      interval: 30s
      timeout: 15s
...
If the operatorMode is omitted from the workspace.yaml, Kusion defaults operatorMode to false.
Overriding with projectSelector
Workspace configurations contain a set of default setting group for all projects in the workspace, with means to override them by Projects using a projectSelector keyword.
Projects with the name matching those in projectSelector will use the values defined in that override group instead of the default. If a key is not present in the override group, the default value will be used.
Take a look at the sample workspace.yaml:
modules:
  ...
  kusionstack/monitoring@0.1.0:
    default:
      operatorMode: True
      monitorType: Pod
      scheme: http
      interval: 30s
      timeout: 15s
    low_frequency:
      operatorMode: False
      interval: 2m
      projectSelector:
      - foobar
    high_frequency:
      monitorType: Service
      projectSelector:
      - helloworld
...
In the example above, a project with the name helloworld will have the monitoring settings where operatorMode is set to False, a 2 minute scraping interval, 15 seconds timeout (coming from default) and http scheme (coming from default).
You cannot have the same project appear in two projectSelectors.
For a full reference of what can be configured in the workspace level, please see the workspace reference.
Updating the workspace config
Assuming you now have a workspace.yaml that looks like the following:
modules:
  kusionstack/monitoring@0.1.0:
    default:
      operatorMode: True
      monitorType: Service
      scheme: http
      interval: 30s
      timeout: 15s
...
Update the workspace configuration by running the following command:
kusion workspace update dev -f workspace.yaml
Verify the workspace config is properly updated by running the command:
kusion workspace show dev
Using kusion to deploy your application with monitoring requirements
At this point we are set up for good! Any new applications you deploy via kusion will now automatically have the monitoring-related resources created, should you declare you want it via the monitoring field in the AppConfiguration model.
The monitoring in an AppConfiguration is declared in the monitoring field. See the example below for a full, deployable AppConfiguration.
Please note we are using a new image quay.io/brancz/prometheus-example-app since the app itself need to expose metrics for Prometheus to scrape:
helloworld/dev/kcl.mod:
[package]
name = "helloworld"

[dependencies]
monitoring = { oci = "oci://ghcr.io/kusionstack/monitoring", tag = "0.2.0" }
kam = { git = "https://github.com/KusionStack/kam.git", tag = "0.2.0" }
service = { oci = "oci://ghcr.io/kusionstack/service", tag = "0.1.0" }

[profile]
entries = ["main.k"]
helloworld/dev/main.k:
import kam.v1.app_configuration as ac
import service
import service.container as c
import monitoring as m
import network.network as n

helloworld: ac.AppConfiguration {
    workload: service.Service {
        containers: {
            "monitoring-sample-app": c.Container {
                image: "quay.io/brancz/prometheus-example-app:v0.3.0"
            }
        }
    }
    # Add the monitoring configuration backed by Prometheus
    accessories: {
        "monitoring": m.Prometheus {
            path:           "/metrics"
        }
        "network": n.Network {
            ports: [
                n.Port {
                    port: 8080
                }
            ]
        }
    }
}
The KCL file above represents an application with a service type workload, exposing the port 8080, and would like Prometheus to scrape the /metrics endpoint every 2 minutes.
Running kusion apply would show that kusion will create a Namespace, a Deployment, a Service and a ServiceMonitor:

Continue applying all resources:

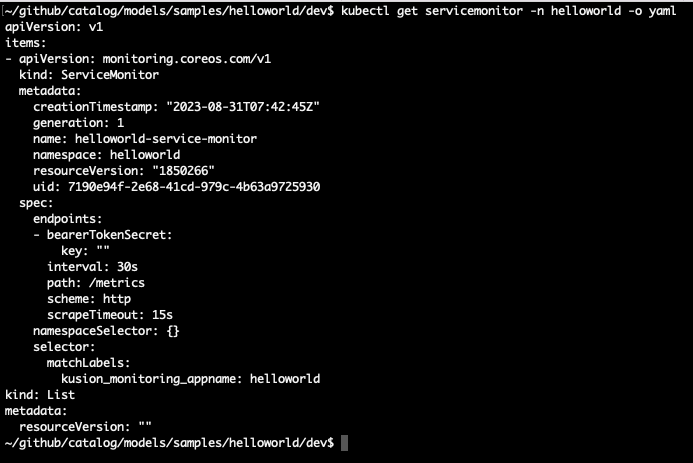
If we want to, we can verify the service monitor has been created successfully:
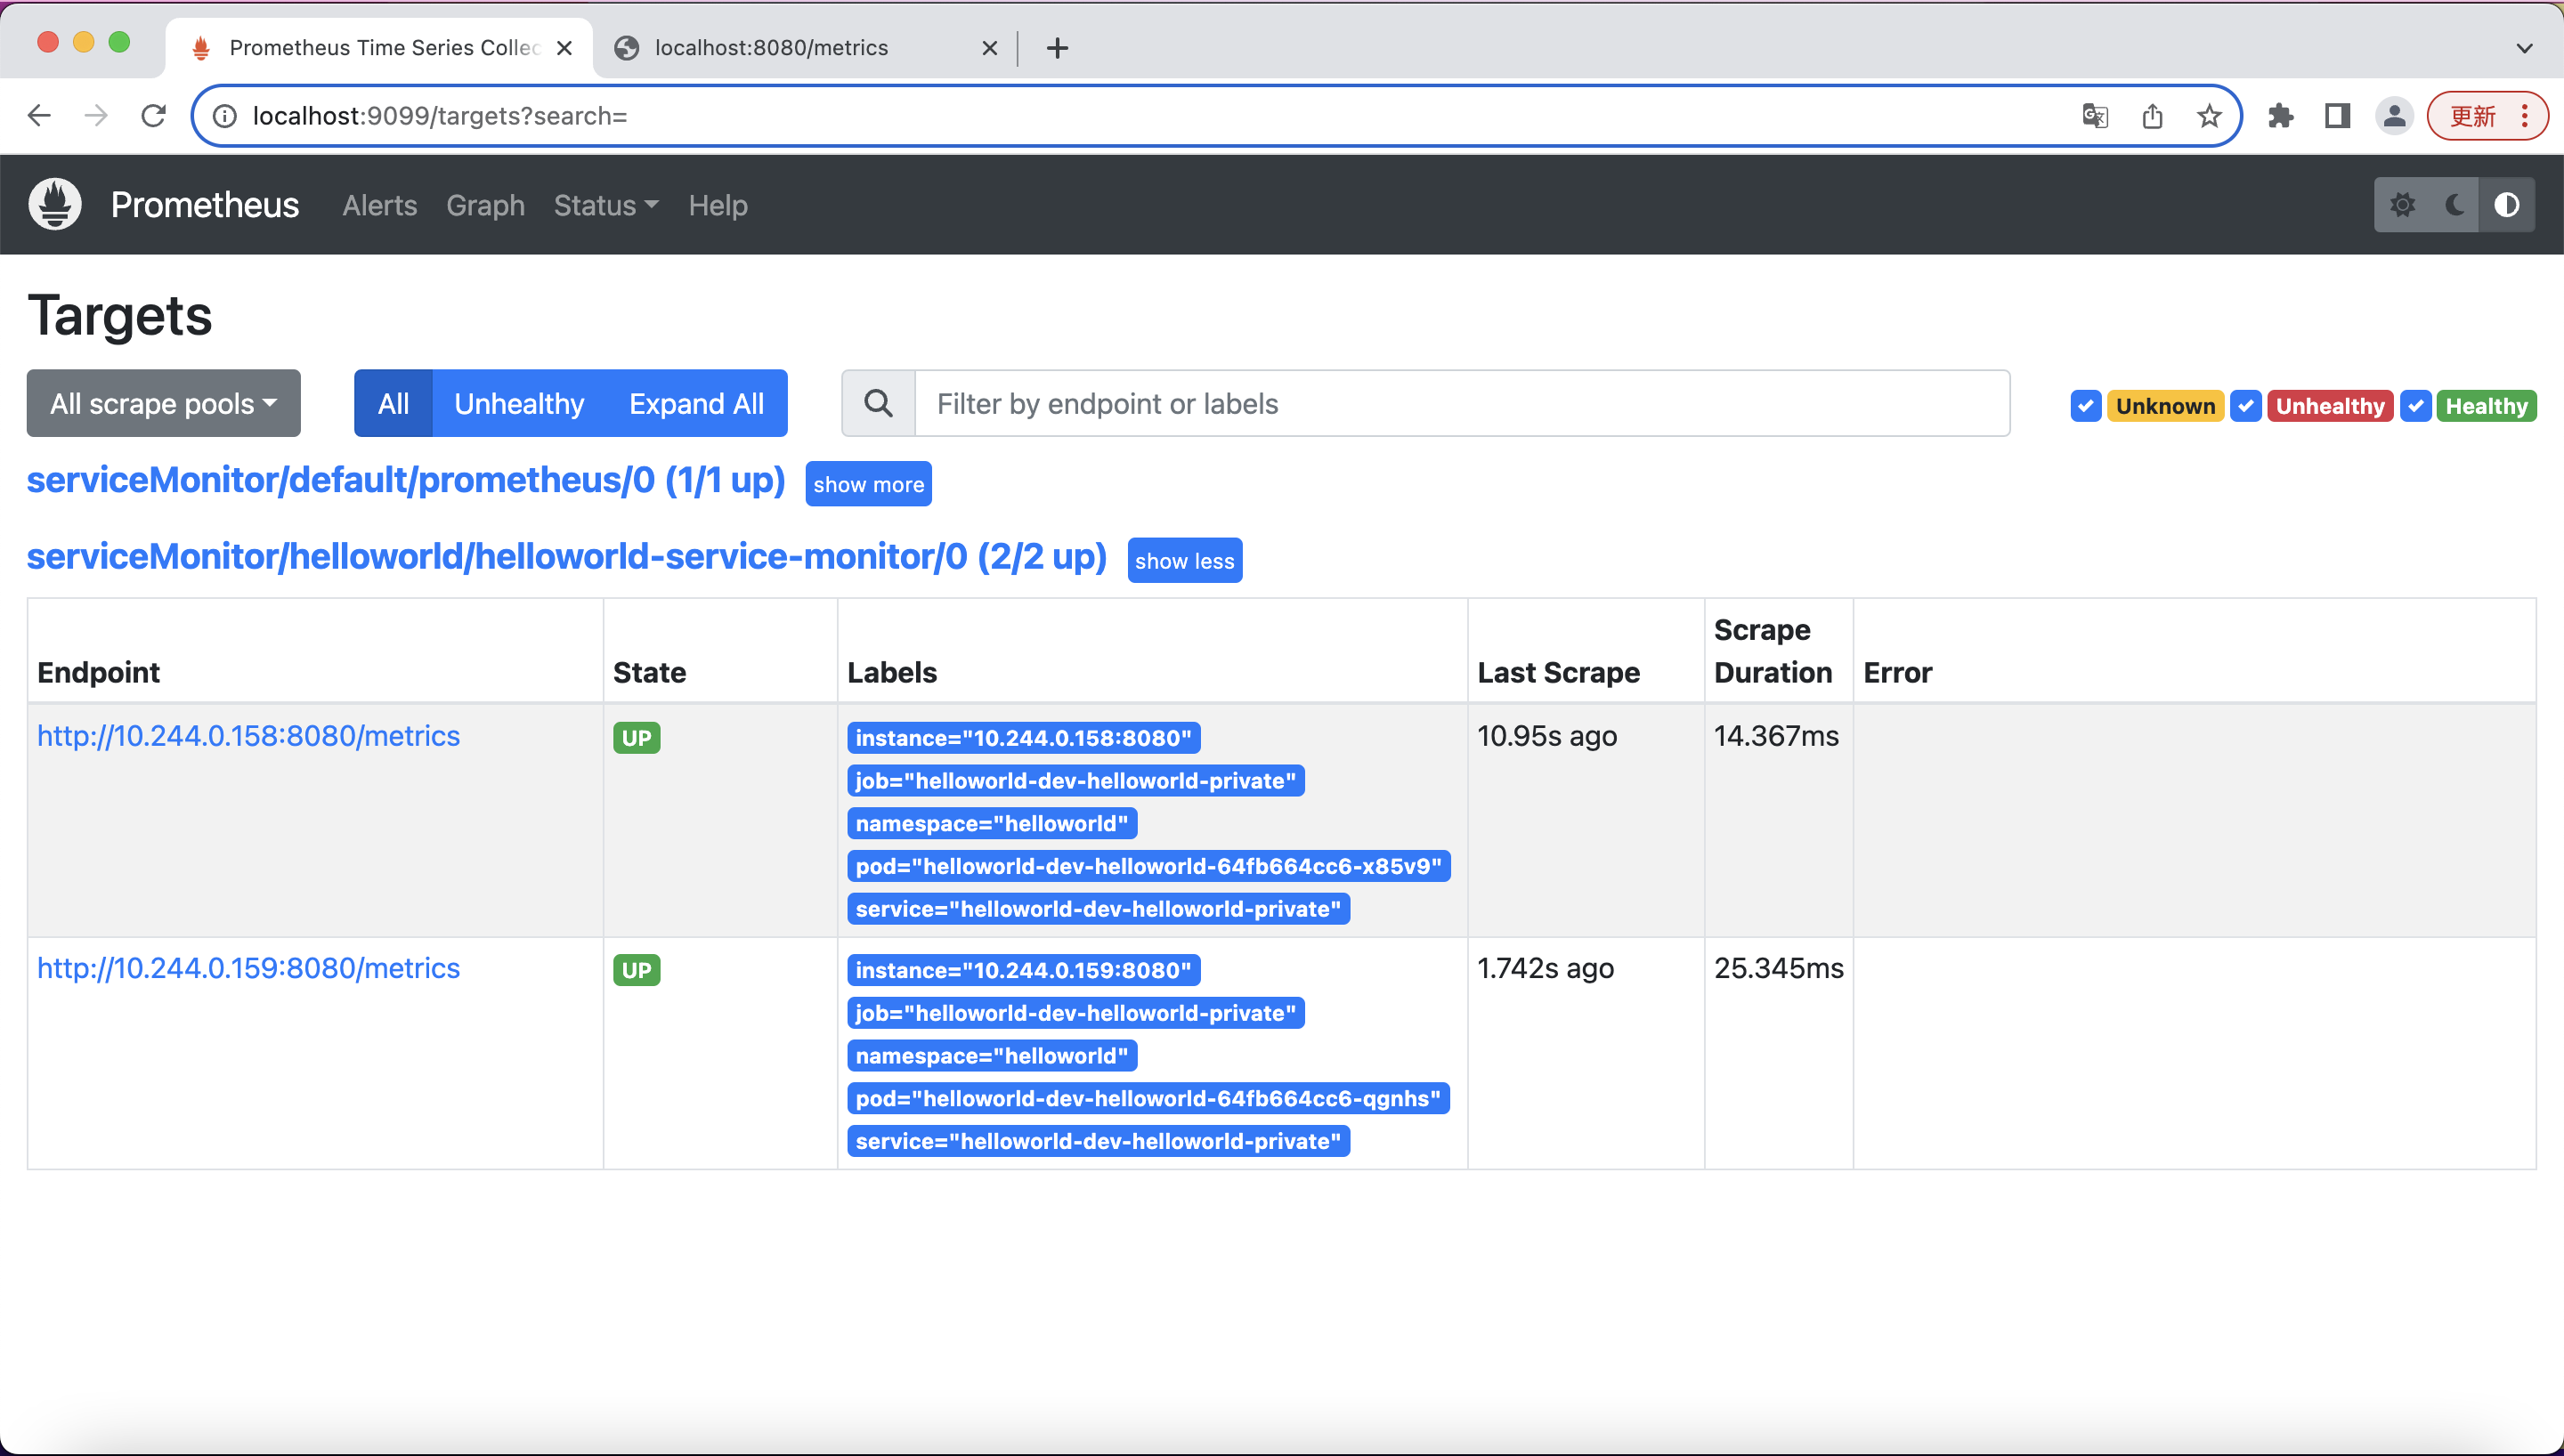
In a few seconds, you should be able to see in the Prometheus portal that the service we just deployed has now been discovered and monitored by Prometheus:
You can run a few simply queries for the data that Prometheus scraped from your application:

For more info about PromQL, you can find them here[4].
References
- Prometheus: https://prometheus.io/docs/introduction/overview/
- Prometheus team advise: https://github.com/prometheus-operator/prometheus-operator/issues/1547#issuecomment-446691500
- Prometheus operator getting started doc: https://github.com/prometheus-operator/prometheus-operator/blob/main/Documentation/user-guides/getting-started.md
- PromQL basics: https://prometheus.io/docs/prometheus/latest/querying/basics/